Flagship · TradingView indicator · 3-day free trial
Universal Ultimate Dashboard: a trend-change indicator for TradingView swing traders
The Universal Ultimate Dashboard was built out of a real need: to identify a change of trend in a stock early and find higher-quality entry points. It combines several trend, momentum and volume conditions, and only prints a BUY or SELL signal when they line up, with a composite confidence score showing how strongly they agree.
$100 /month
Universal Ultimate Dashboard at a glance
- Platform
- TradingView (desktop & mobile)
- Best timeframes
- 4H, daily, weekly
- Markets
- Stocks, crypto, indices
- Signals
- BUY & SELL on bar close
- Price
- $100 / month · 3-day free trial
See Universal Ultimate Dashboard in action
Videos are historical chart replays for illustration only and do not guarantee future results.
How it works
What the Ultimate Dashboard shows on your chart
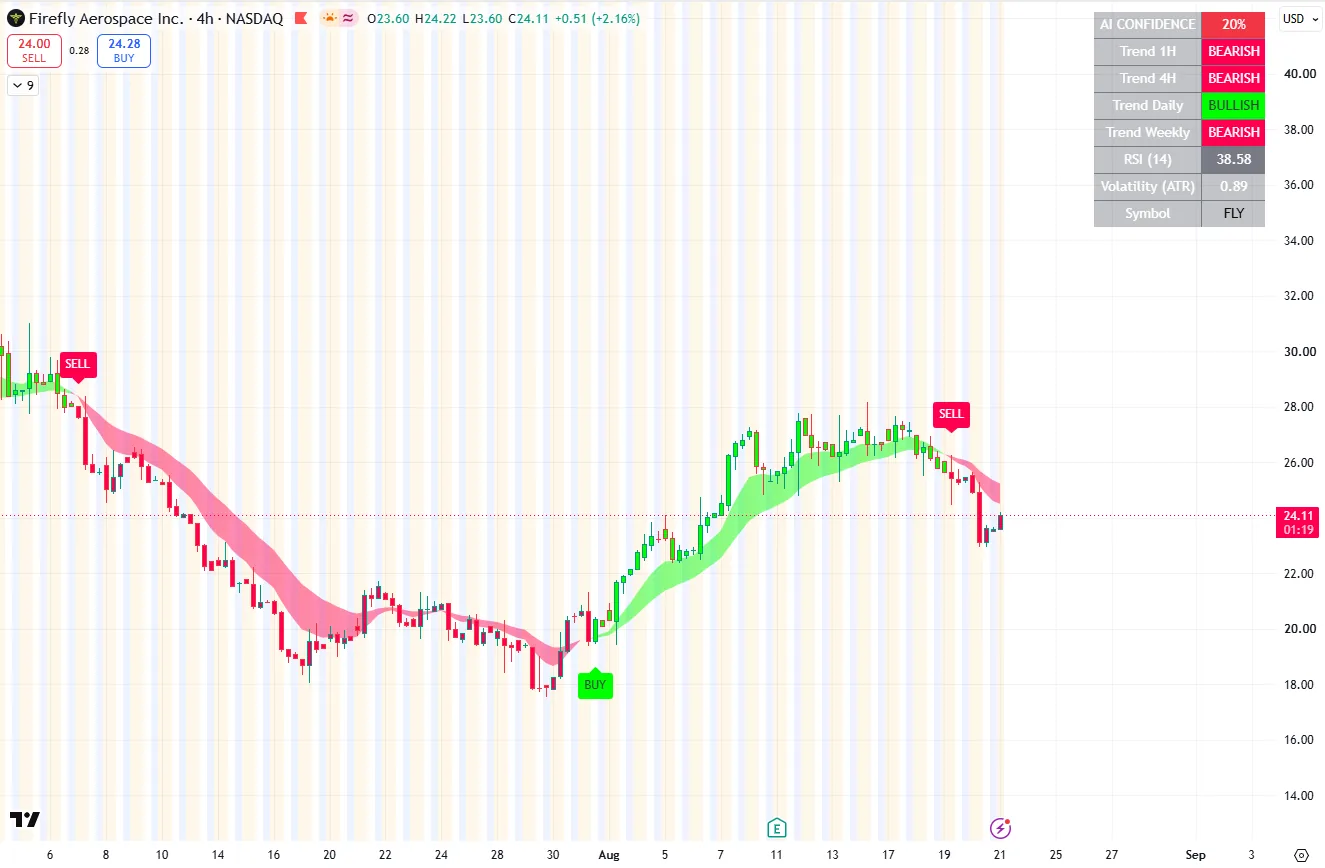
A technical indicator is a calculation based on an asset's historical price and volume, drawn on the chart to cut through noise. The Ultimate Dashboard goes a step further: instead of one line, it checks several parameters at once and alerts you visually with a BUY or SELL label only when they are in order.
- Multi-timeframe trend matrix – see at a glance whether timeframes agree.
- Composite confidence score – how strongly trend, momentum and volume align.
- Dynamic trend ribbon plus RSI and volatility readings.
- Market structure detection and entry/exit labels confirmed on bar close.
Which timeframe works best?
The indicator works on any timeframe, but it performs best on the 4-hour, daily and weekly charts, and the strongest signals appear on the weekly chart. The lower the timeframe, the less reliable the signals become.
The signal timeframe also tells you the expected holding period: a daily signal points to a move measured in days and weeks, a 5-minute signal to a move measured in minutes. For most traders the daily chart is the recommended starting point.
Working strategy
Which signals are the highest quality?
Keep the default settings – the indicator was tuned to perform best without changes. Then confirm each signal with additional context before entering. The strongest signals tend to appear when:
- Price breaks through a clear support or resistance level
- Volume is unusually large compared with recent sessions
- The price move behind the signal is strong
- Price is supported or rejected by key moving averages, especially the 9 and 150
Trader checklist
An 8-step checklist before every trade
1. Study the chart
Pick a stock, follow it for a while and read up on the company.
2. Identify the trend
Check that the stock's trend agrees with its sector and with the index.
3. Choose your timeframe
Remember that the signal timeframe sets the expected length of the move.
4. Get the signal
Wait for the indicator to print a signal that confirms the trend direction.
5. Check the context
Look for supporting moving averages, unusual volume and news at the signal point.
6. Size the position
Decide what percentage of your portfolio, and how much money, you are willing to risk.
7. Place a protective stop
Set a stop-loss order that protects you if the trade doesn't work.
8. Take profit as planned
Decide your exit in advance and take profit when price reaches it – don't get greedy.
Realistic expectations and risk management
No indicator is always right, and this one can be wrong too. Unexpected news, an earnings surprise or a single tweet can move a stock against any signal. That is why every trade needs a predefined risk per trade, a tight stop-loss order and a planned profit target.
Used this way, the Ultimate Dashboard is a tool that improves your odds and helps you read the direction of a stock, not a guarantee.
Universal Ultimate Dashboard is a good fit if…
- You swing trade stocks, crypto or indices on 4H, daily or weekly charts
- You want several confirmations combined into one signal
- You want to see multi-timeframe agreement at a glance
It's probably not for you if…
- You scalp 1-minute charts – Apex Intraday Flow Pro fits better
- You want automated trading – this is a decision-support tool
- You expect every signal to win – risk management is still required
Getting started
How to add Universal Ultimate Dashboard to TradingView
1. Create a free TradingView account
If you don't have one yet, open a free account on TradingView. The indicators run on TradingView in the browser, desktop app and mobile app.
2. Complete checkout and share your username
After checkout, access is granted to your TradingView username. Make sure the username you provide is spelled exactly as it appears on TradingView.
3. Add the indicator to your chart
Open any chart, click Indicators and search for the indicator by name (it also appears under Invite-only scripts). The default settings are the recommended starting point.
4. Not showing up? Contact support
Send your exact TradingView username to support by email or Telegram and access will be checked, usually within 24 hours.
Universal Ultimate Dashboard FAQ
What is the best timeframe for the Universal Ultimate Dashboard?
It works on any timeframe, but performs best on the 4-hour, daily and weekly charts. The strongest signals are on the weekly chart, and the daily chart is the recommended starting point.
Does the Ultimate Dashboard work on crypto and indices?
Yes. It works on stocks, crypto and indices – any symbol you can chart on TradingView.
Is there a free trial?
Yes, the Universal Ultimate Dashboard comes with a 3-day free trial.
Can I still enter after a signal has already printed?
You can, but check the surrounding context first. If the signal printed a while ago, part of the move may already have happened, so factor that into your entry and stop.
What if the market reverses right after I enter?
It happens, often because of an external event. That's why you should always know how much you are risking on the trade and place a stop-loss order before anything else.
Ready to try Universal Ultimate Dashboard?
Start with a 3-day free trial, then $100/month. Cancel any time.
Compare with our other indicators
Risk disclosure: Trading financial instruments involves significant risk and is not suitable for every investor; you could lose all of your capital. Universal Indicator tools are analytical aids for educational purposes, not financial advice, and do not guarantee profits. Past performance and chart examples do not indicate future results. Read the full disclosure and terms.